The "Volatility" screen under the Watchlist Overview tab provides an overview of the price volatility for all the currency pairs contained in a watchlist.
Volatility is a term used to refer to the fluctuations in price over time. The more price fluctuates, the higher the volatility is considered to be.
This tool allows you to see which currency pairs are wild and which are tame when it comes to price fluctuations.
The chart shows the extent of price fluctuation between the high and low prices during the selected time interval and time range. watchlist-volatility.png270.54 KB The example above analyzes the volatility of the currency pairs that are in The Majors watchlist.
Since the Time Interval selected is "1h" (located in the Settings panel) and the Time Range selected is "30D" (located at the top of the chart), the charts displays the average hourly volatility over the last 30 days.
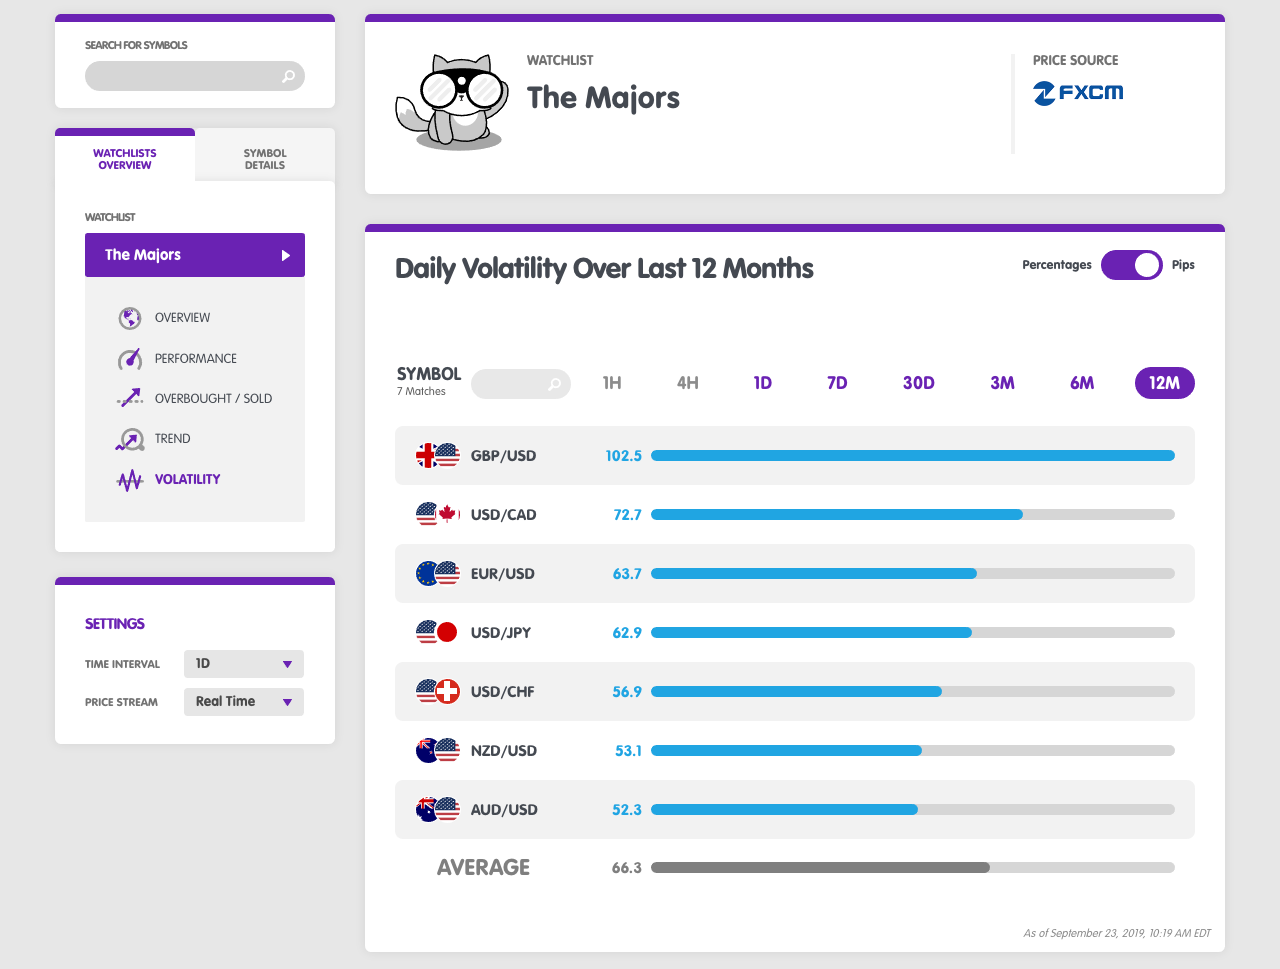
What if you're not a short-term trader and don't care about hourly volatility? What if you're more interested in daily volatility?
Since the Time Interval selected is "1D" (located in the Settings panel) and the Time Range selected is "12M" (located at the top of the chart), the charts displays the average daily volatility over the last 12 months.
Switch between "%" and Pips
You can view volatility measured in percentage terms (%) or in pips.
Simply click on the toggle located in the upper right part of the chart. watchlist-volatility-daily-over-12-months-toggle.png265.84 KB In the example above, we can see that GBP/USD is the most volatile pair in the watchlist, with an average daily volatility of 102.5 pips over the last 12 months.
We can also see that AUD/USD is the least volatile pair in the watchlist, with an average daily volatility of 52.3 pips over the last 12 months.
Notice how the "AVERAGE" volatility of the watchlist is also provided.
This allows you to quickly determine whether a specific currency pair's volatility is considered high (above average), low (below average) or normal (about average) relative to the group.