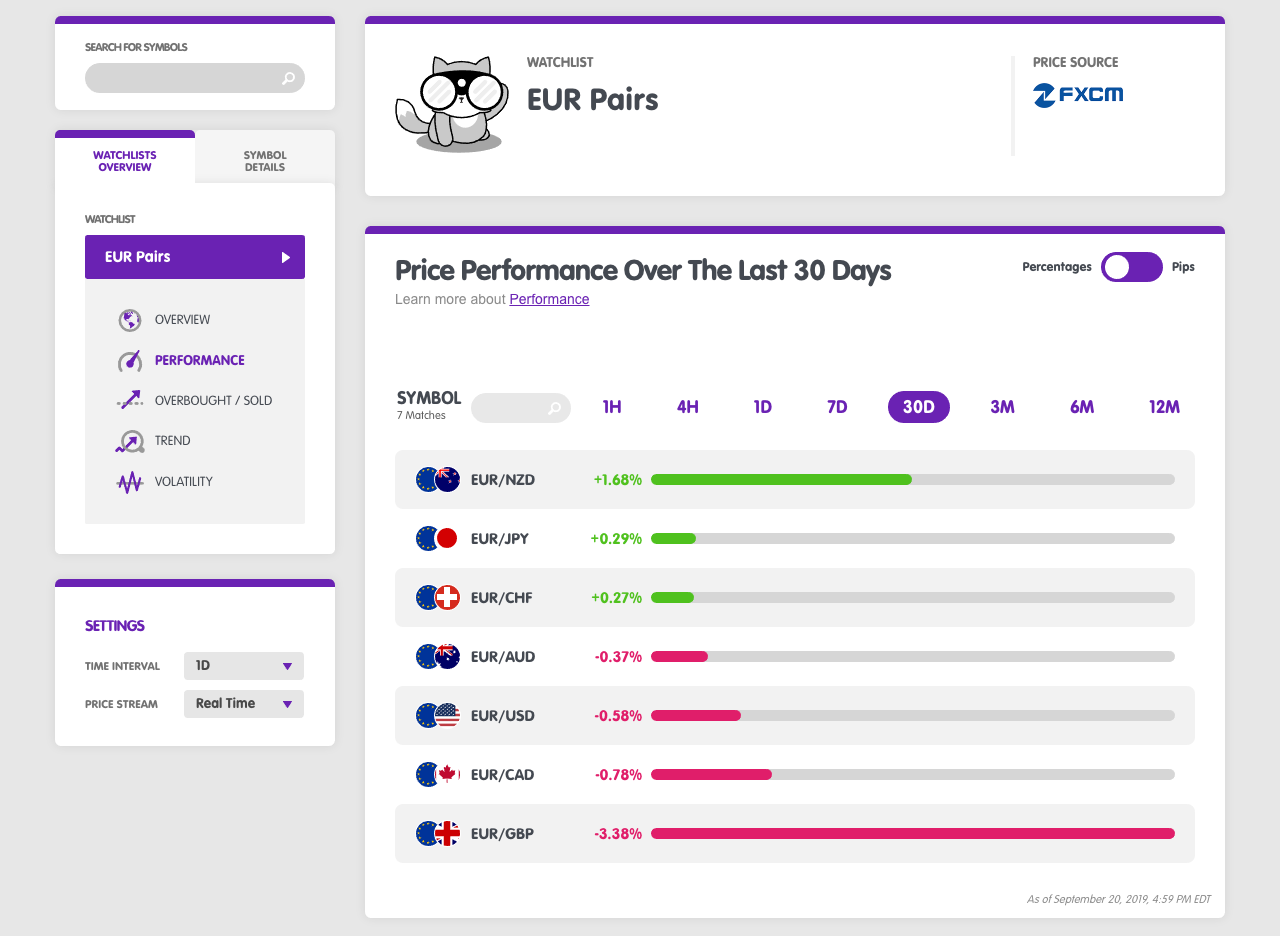
The "Performance" screen under the Watchlist Overview tab displays a list of all the currency pairs contained in a watchlist and their respective price performance over a specific time range. watchlist-performance.png269.36 KB The example above shows the price performance of the currency pairs that are part of the EUR Pairs watchlist.
Time Range
The time range or "lookback period" is how much historical data will be used to determine price performance.
In this example, the time range is selected is "30D".
This allows us to see how each currency pair performed over the last 30 days.
If you'd like to see how the currency pairs performed over the last 7 days, simply click on "7D".
If you'd like to see how the currency pairs performed over the last 12 months, simply click on "12M".